Portfolio
Fisuyi B Anthonia
Expert in end-to-end data solutions: scalable pipelines (Python, SQL, Airflow), ETL/API-driven integrations, and cloud platforms (Azure/GCP). Proficient in advanced analytics (Excel, SPSS) and visual storytelling (Power BI, Tableau) to translate raw data into actionable strategies. Skilled in Git for collaborative development, with domain expertise in HR analytics (workforce optimization, talent insights) and business intelligence (operations, customer behavior). Delivered robust architectures, data warehousing, and automation tools that drive cost efficiency, growth, and data-driven decision-making. Let’s connect to transform your data into measurable business outcomes.

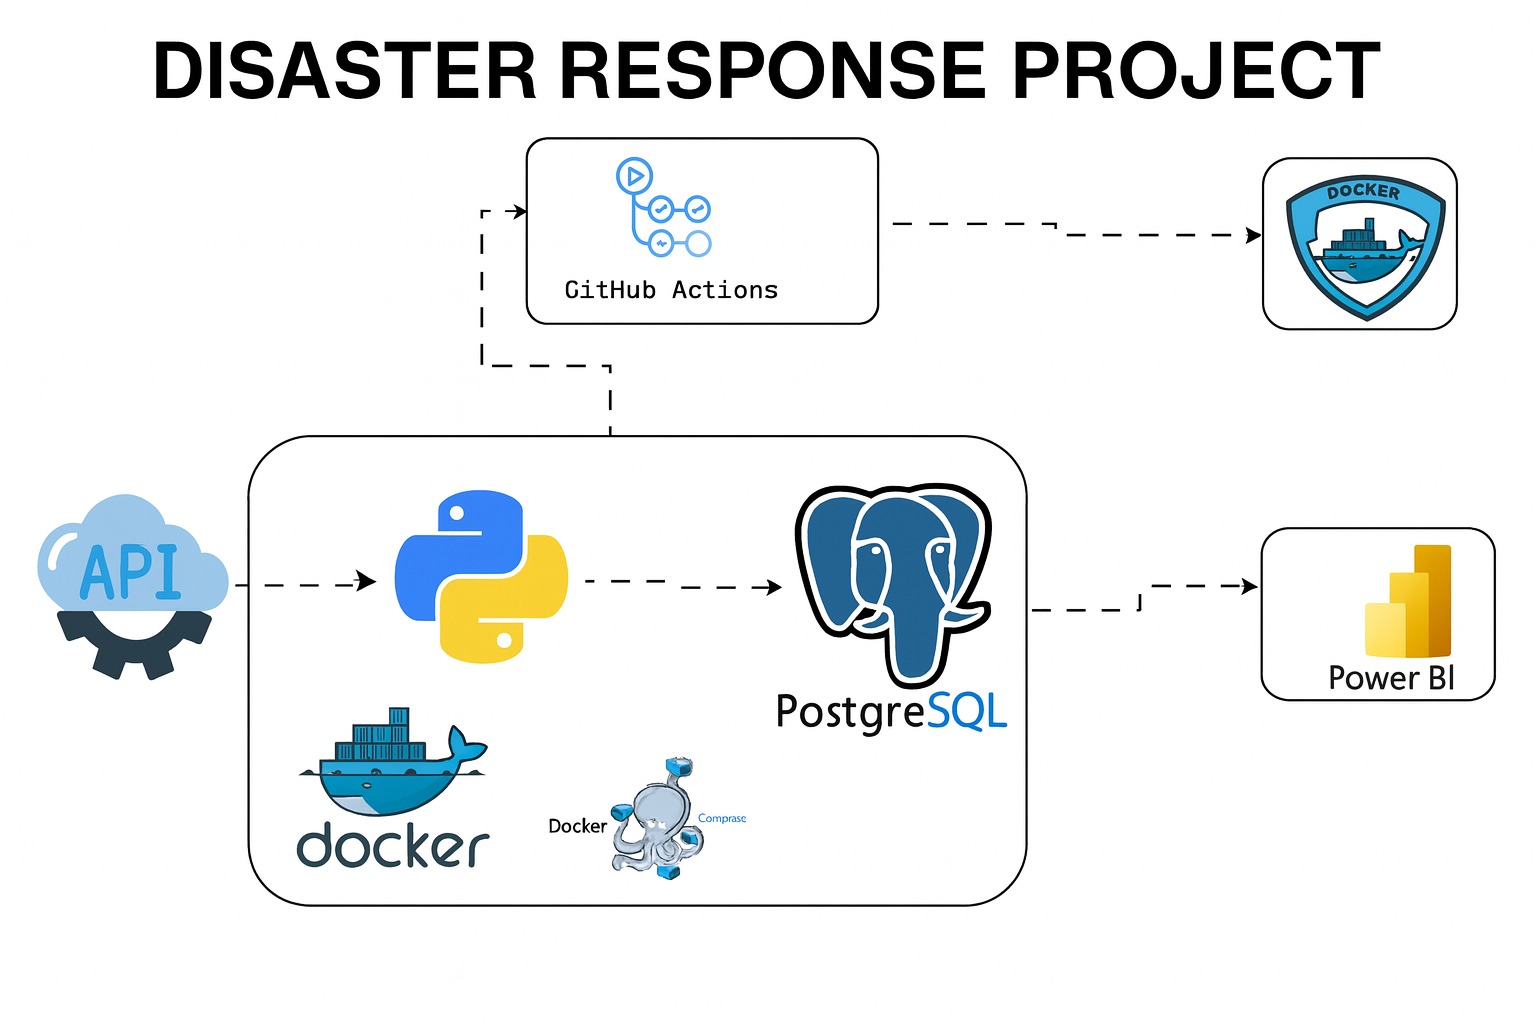
A fully containerized, CI/CD-driven ETL pipeline that ingests FEMA’s open disaster recovery data, transforms it with Python, stores it in PostgreSQL, and powers real-time KPI dashboards for insurers. Built with Docker, GitHub Actions, and Power BI, this project demonstrates end-to-end automation in operational analytics for high-impact disaster response.
More Stories
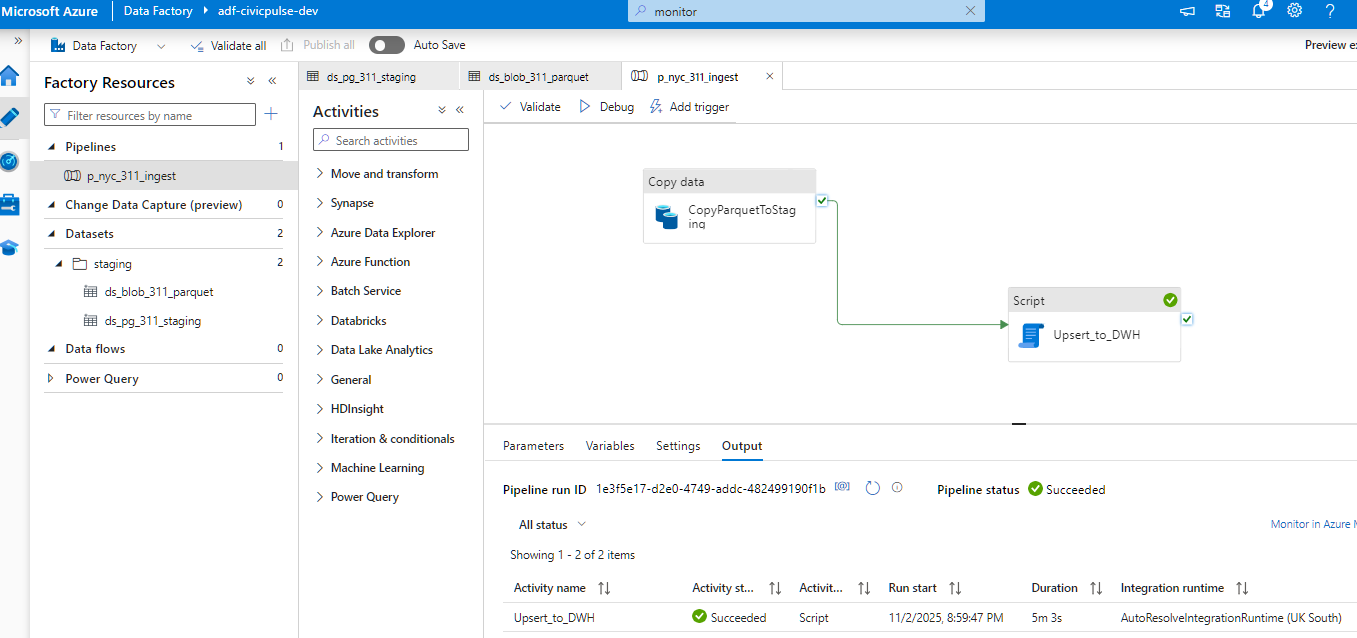
Automating NYC 311 Insights with Airflow, ADF, Terraform and a PostgreSQL Data Warehouse: Transforming the world’s busiest civic service dataset into live, actionable insights
CivicPulse 311 is a cloud-native analytics pipeline engineered to ingest, clean, and transform New York City’s 311 service requests into real-time operational intelligence. Designed with Airflow, Azure Data Factory, PostgreSQL, and Terraform IaC, this platform automates the full ELT lifecycle and powers dashboards that reveal citywide service patterns, SLA performance, and community-level equity trends.
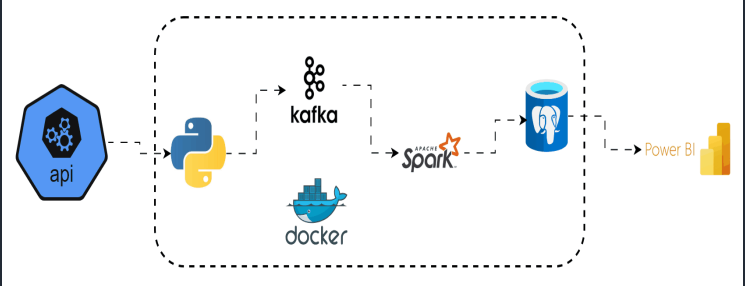
Real-Time Stock Market Analytics Pipeline Using Kafka, Spark & Docker: Building a Production-Grade, Multi-Symbol Financial Data Stream — End to End
This project is a fully containerised, real-time market analytics pipeline engineered to ingest multiple stock symbols simultaneously, stream live OHLCV data through Kafka, process events using Spark Structured Streaming, store clean time-series records in PostgreSQL, and visualise market behaviour instantly in Power BI. It mirrors the distributed streaming architectures used inside fintech, trading desks, and data engineering teams—built with open-source tools, optimized for resilience, and designed to scale.
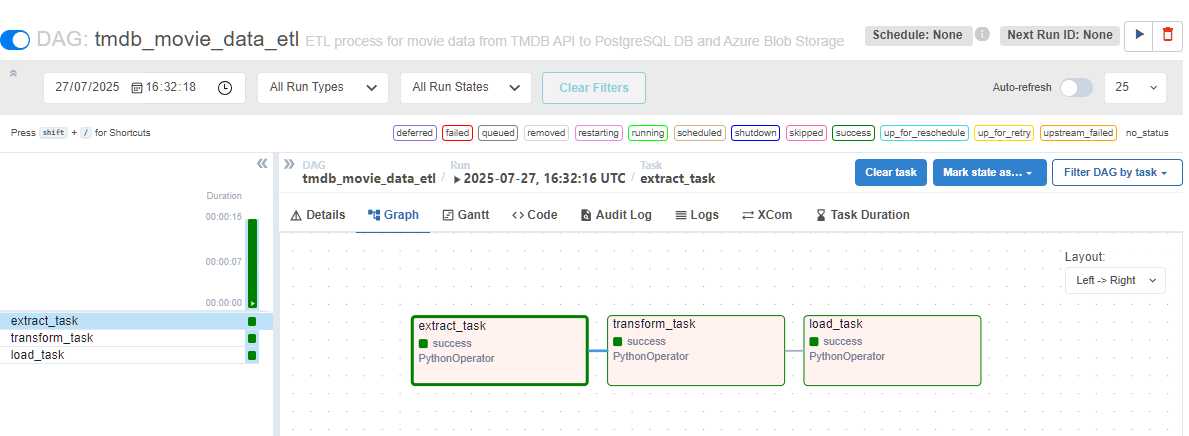
From API to Azure & Database: Building a Modular ETL Pipeline for TMDB with Airflow, PostgreSQL & pgAdmin
This project walks through a hands-on ETL pipeline using The Movie Database (TMDB) API, orchestrated with Apache Airflow, loaded into PostgreSQL, and visualized/debugged via pgAdmin. Learn how to build, monitor, and validate your ETL stack with cloud integration via Azure Blob Storage.
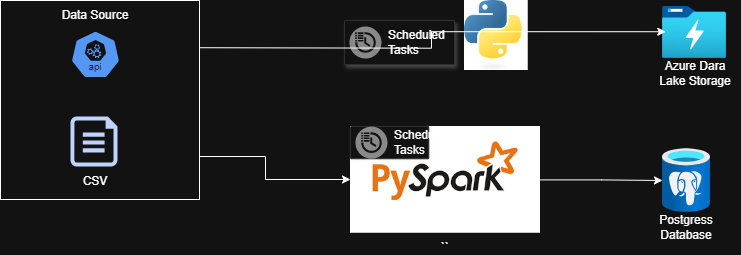
Batch ETL Pipeline (Pyspark , Azure Blob Storage) and Task Scheduler Orchestration (On-Premise)
This project aims to automate the Extract, Transform, Load (ETL), Extract, Load, Transform (ELT), and Extract, Transform, Load, and Loop (ELTL) processes to enhance data pipeline efficiency. By leveraging cloud-based solutions and orchestration tools, the system ensures seamless data integration, transformation, and storage while minimizing manual intervention.
Pipelines with Purpose: Automating Multi-Source ETL Using Python and PostgreSQL
From messy to modelled: This ETL pipeline extracts from multiple sources, normalizes data into 3NF, and loads it into OLTP and OLAP PostgreSQL schemas — with constraints, surrogate keys, and ERD visualizations all handled programmatically.
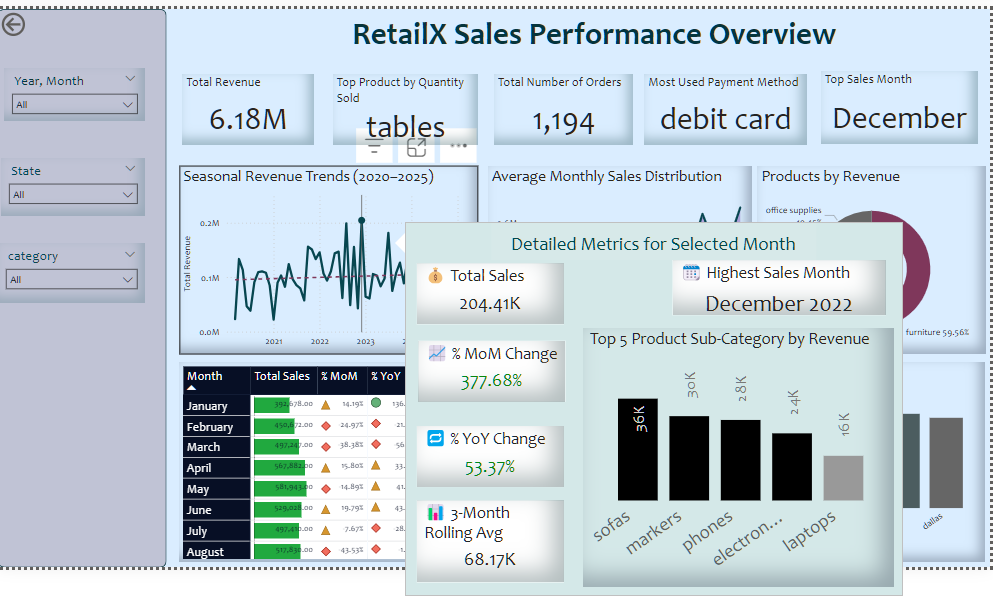
Building a Sales Intelligence Pipeline: From Raw Data to OLTP ETL to Data Insights
This case study follows the complete journey of transforming raw sales data into actionable business insights. It covers ETL for OLTP modeling in PostgreSQL, data cleaning in Python, and sales performance analytics to support data-driven decisions for product, region, and customer strategies.
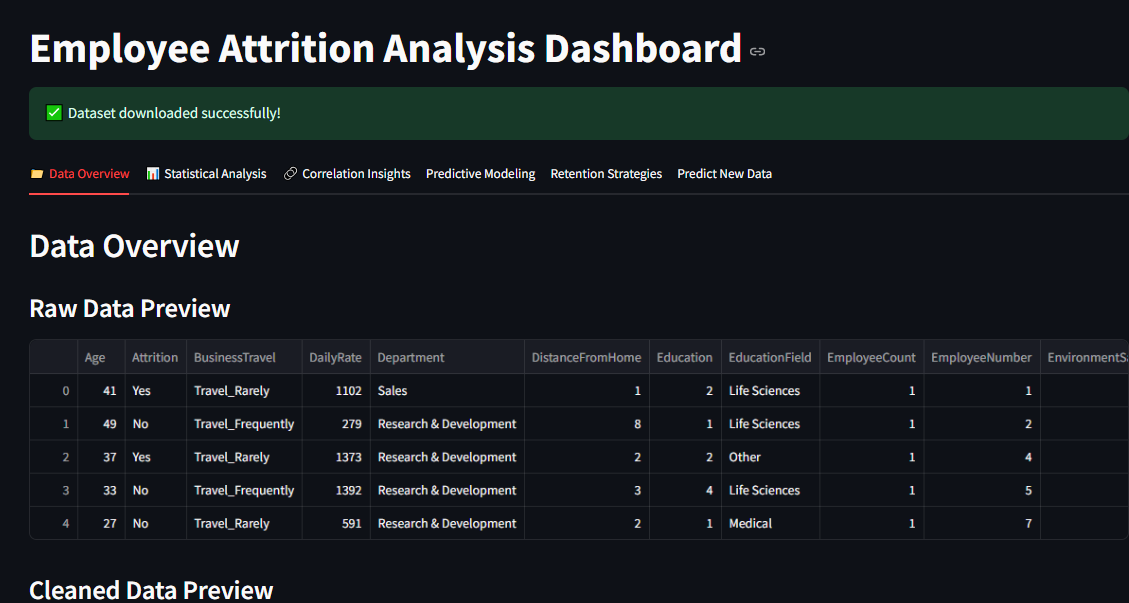
Advanced Data Analysis for HR Attrition Using Python
Unlock the power of Python for HR attrition analysis. Dive into strategies for data quality checks, attrition rate visualization, and predictive modeling to enhance workforce management.
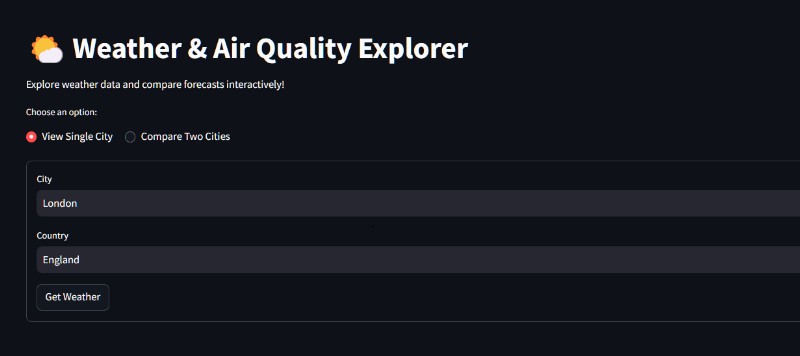
Real-Time Weather Dashboard with Streamlit & OpenWeather API
Designed and developed an interactive dashboard using Python and Streamlit to fetch and display real-time weather data via the OpenWeather API. The app allows users to compare key metrics like temperature, humidity, and air quality, with an option to save the results as a CSV file. Git was used for version control and collaboration.
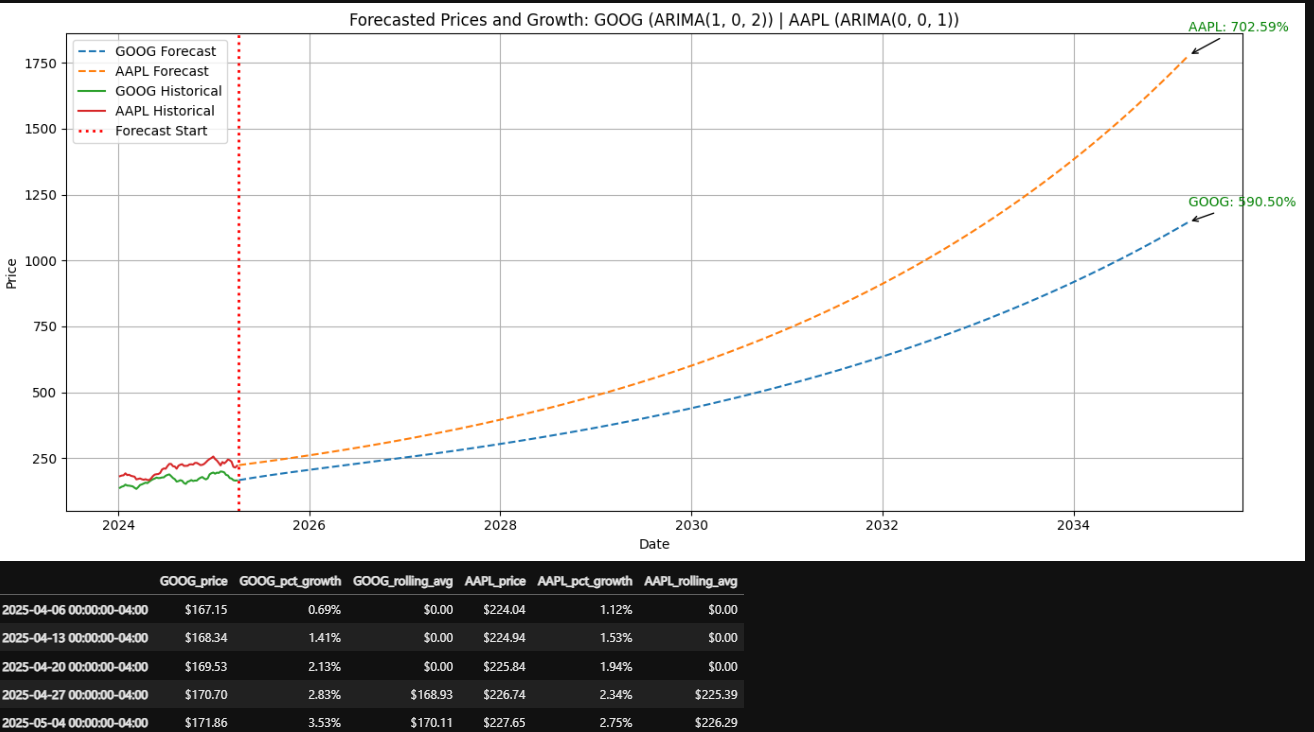
Enhancing Stock Market Predictions: A Deep Dive into ARIMA Modeling
Explore advanced techniques for stock market forecasting, highlighting the power of ARIMA models, data preprocessing, and residual analysis to make financial forecasting more precise and efficient

Optimizing Mental Health Data Management Using SQLAlchemy
Discover how studying abroad impacts mental health through data-driven insights. Analyzing 2018 survey data from a Japanese university, this SQL and Python-powered study reveals key correlations between social connectedness, acculturative stress, and depression—with actionable recommendations to support international students. Read the full analysis.

Selling Smarter: Predicting Customer Conversion in Bank Telemarketing Campaigns with Machine Learning
Cold calls are costly. What if we could predict which customers are most likely to say "yes" before dialing? In this project, I built a predictive modeling pipeline that helps banks focus on leads that convert—saving time, money, and morale.
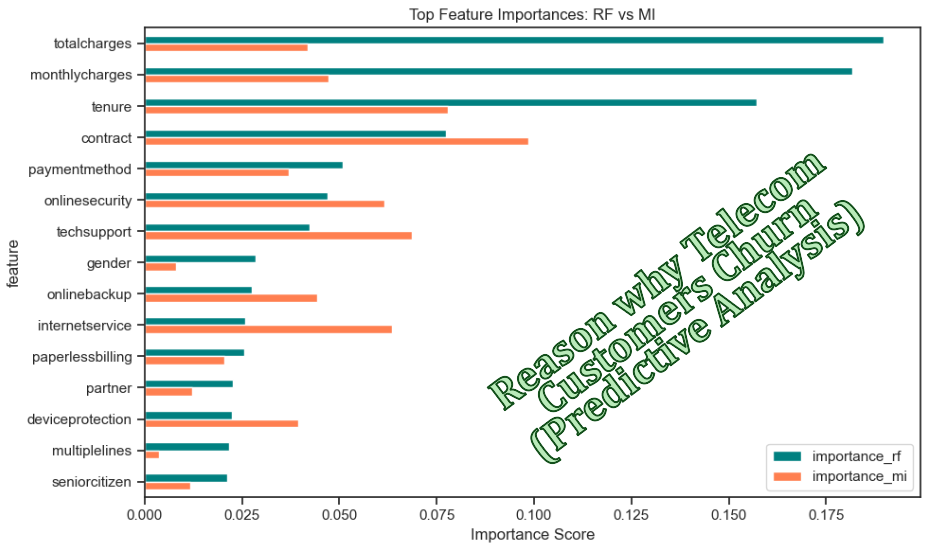
Predicting Customer Churn Using Machine Learning in Telecommunications
Customer churn poses significant challenges for telecom providers, especially in a competitive market. This analysis explores the use of machine learning to predict churn, highlighting real-world scenarios such as identifying customers with month-to-month contracts or high monthly charges. Learn how to clean data, handle imbalances, and build models using techniques like Logistic Regression, Random Forest, and KNN. Perfect for data scientists and telecom industry professionals, this guide provides actionable insights to create retention strategies that not only reduce churn
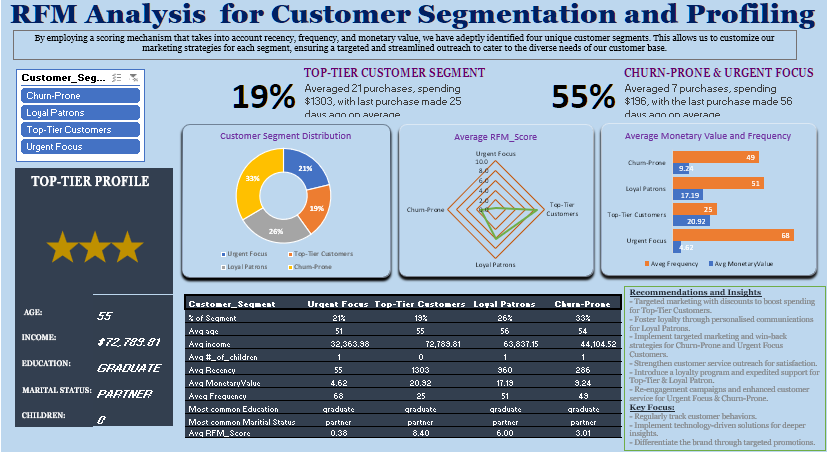
Mastering Customer Segmentation with RFM Analysis: Boost Engagement and Revenue
Discover how RFM (Recency, Frequency, Monetary Value) analysis can transform your customer segmentation strategy. By leveraging these key metrics, businesses can identify high-value customers, re-engage at-risk segments, and tailor marketing efforts for maximum impact. Learn how to implement RFM analysis to drive loyalty and revenue growth.