
Disaster Response Analytics — A Dockerized Python ETL + PostgreSQL Platform for Real-Time FEMA Insights
1. Project Purpose — Turning Disaster Chaos Into Operational Clarity
Disasters don’t wait. Neither should analytics.
Insurance teams need immediate visibility into which regions were hit, how funding is allocated, and which claims are likely to surge next. But disaster data from public sources like FEMA is raw, delayed, and scattered across multiple endpoints.
The goal of this project was to build a production-ready, fully automated pipeline that could:
-
Continuously ingest FEMA disaster project data
-
Clean and normalize it into a usable schema
-
Store it securely in PostgreSQL
-
Refresh analytics dashboards automatically
-
Run reliably inside Docker containers
-
Deploy seamlessly through CI/CD
This system removes all manual steps from the loop — letting insurers focus on decisions, not data wrangling.
2. The Business Challenge — Real-Time Insight During Real-World Emergencies
Insurers face three major bottlenecks during natural disasters:
1. Data arrives too slowly
Public disaster feeds update frequently, but manual CSV extractions or ad-hoc API calls create days of delay.
2. Claims departments get overwhelmed
Storms, floods, or wildfires can generate hundreds of claims within hours. Without predictive signals, staffing and resource allocation become reactive.
3. Data lives in silos
Government data, internal claims, geospatial records — none of it connects automatically.
These gaps slow down recovery efforts, frustrate customers, and expose insurers to operational and regulatory risk.
This project eliminates those gaps with continuous ingestion, automated processing, and centralised storage.
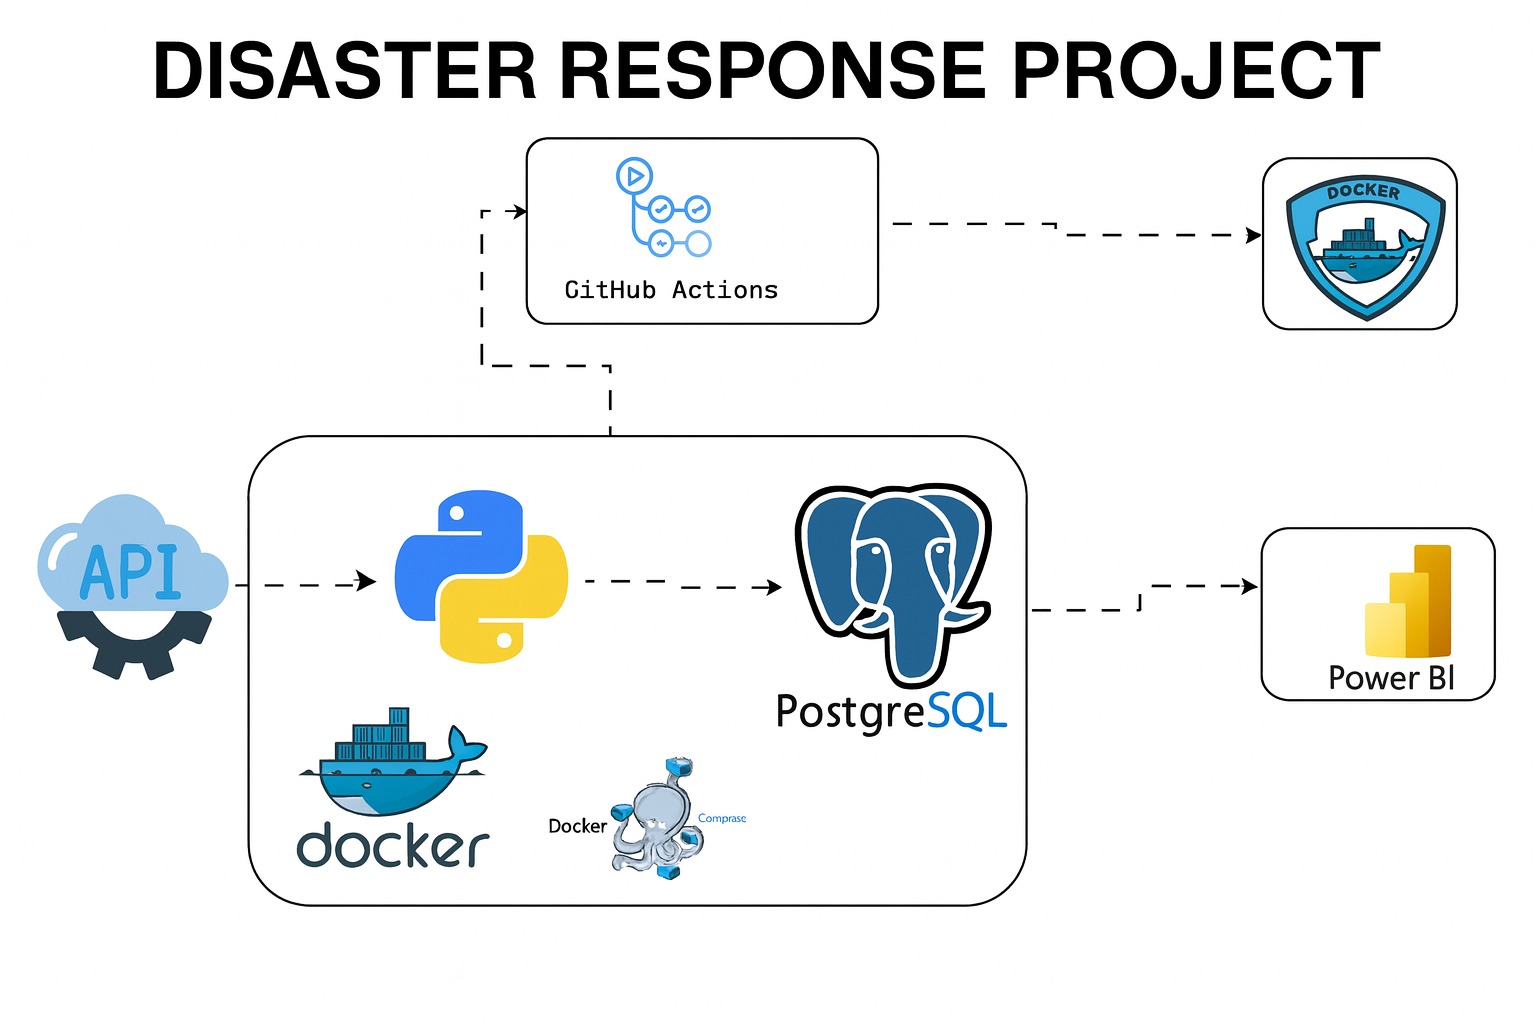
3. Architectural Overview — Simple, Scalable, and Fully Automated

The pipeline follows a clean data flow:
FEMA API → Python ETL → Dockerized Pipeline → PostgreSQL → Power BI Dashboard → CI/CD Automation
Each component is engineered to handle real operational workloads — minimal maintenance, maximum resilience.
4. How the Pipeline Works — Layer by Layer
A. Data Ingestion (Python ETL Service)
A Python ETL service performs:
-
API calls to FEMA’s open data platform
-
Normalization of nested JSON structures
-
Incremental loading using timestamp watermarks
-
Deduplication and schema enforcement
-
Logging and error handling inside the container
Snippet: API → Normalized Row
response = requests.get(FEMA_API_URL).json()
projects = normalize_fema_projects(response)
load_to_postgres(projects)
This ensures the system always fetches only new or updated disaster records.
B. Containerized Execution (Docker & Compose)
The entire ETL workflow runs inside Docker:
-
deterministic environment
-
version-locked dependencies
-
identical behaviour across machines
-
isolated network for Postgres
-
monitored, restartable ETL container
docker compose up -d --build
The pipeline becomes portable: local, cloud VM, on-prem — same behaviour everywhere.
C. Centralized Storage (PostgreSQL)
PostgreSQL stores:
-
FEMA disaster projects
-
Flat, analytics-ready tables
-
Indexed columns for rapid KPI queries
Example shape of the processed table:
project_id | disaster_number | state | county | obligation | date | category
Designed for fast aggregations across thousands of disaster events.
D. Automated Deployment (GitHub Actions CI/CD)
Pushing updates triggers:
-
ETL container build
-
Image push to Docker Hub & GHCR
-
Deployment-ready images for production
This makes the ETL pipeline self-updating, versioned, and fully automated.
E. Dashboarding (Power BI)
Power BI connects to the PostgreSQL warehouse and exposes KPIs such as:
-
total obligated funds
-
state-by-state disaster impact
-
category-level funding patterns
-
recovery trends across time
-
project approval timelines
With automated ETL pipelines, the dashboard becomes near real-time.
5. Why This Engineering Approach Works
This project demonstrates practical engineering principles: ✔ Containerized ETL
No dependency conflicts, consistent runtime, predictable behaviour. ✔ Incremental ingestion
Efficient updates — no full reload required. ✔ PostgreSQL warehouse
Clean schema, indexed queries, durable storage. ✔ CI/CD workflow
Automated builds and deployments. ✔ Power BI dashboarding
Instant business value through visual insights. ✔ End-to-end automation
No developer intervention needed after setup.
This is modern data engineering — clean, resilient, reproducible.
6. What This Enables for Insurance Operations
Once live, the pipeline unlocks:
-
real-time disaster monitoring
-
prioritisation of high-impact claims
-
visibility into regional exposure
-
faster operational response
-
predictive modelling potential
-
better customer experience during crises
It gives insurers the ability to respond instead of react.
7. Project Repository Structure (Simplified for Web)
DisasterResponseAnalytics/
│── etl/                     # Python ETL logic (Dockerized)
│── db_init/                 # PostgreSQL schema & indexing
│── dashboards/              # Power BI files
│── .github/workflows/       # CI/CD pipelines
│── docker-compose.yml       # Local development stack
└── compose.prod.yml         # Production deployment
A clean, modular repo — built for extensibility.
8. Future Enhancements
-
Add weather radar overlays (NOAA API)
-
Integrate insurer claims data for predictive analytics
-
Deploy to Kubernetes for auto-scaling
-
Embed automated email/SMS alerts for peak events
-
Add Grafana dashboards for engineering observability
Conclusion — Fast, Automated Insight When It Matters Most
Disaster response requires speed, reliability, and clarity.
This project delivers all three.
By combining Dockerized ETL, PostgreSQL warehousing, CI/CD automation, and Power BI dashboards, this pipeline transforms raw FEMA data into actionable intelligence — helping insurers prepare, respond, and recover faster when disaster strikes.
It’s production-ready, extensible, and built to solve real problems under real pressure.