
Real-Time Weather Dashboard with Streamlit & OpenWeather API
Building a User-Friendly Weather Insights Tool with Python & Streamlit
Introduction
Weather plays a vital role in daily decision-making, from planning outdoor activities to monitoring air quality. This project combines data engineering and visualization to create an interactive weather insights tool, offering real-time updates on key weather indicators.
Project Overview
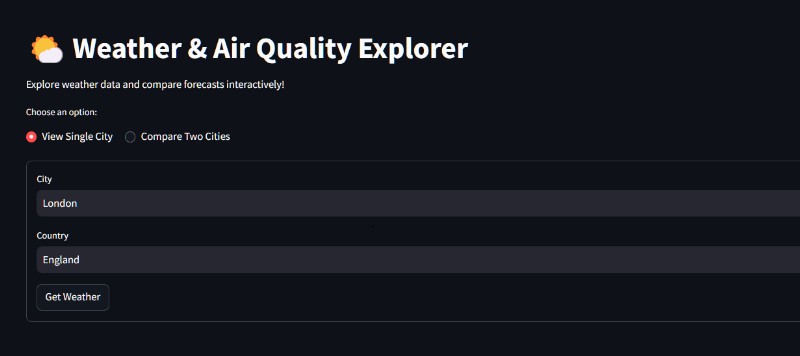
The tool is built using Python and Streamlit, fetching live data from the OpenWeather API based on user-inputted locations. Users can view and compare essential weather metrics, including:
-
Temperature
-
Humidity
-
Wind Speed
-
Air Quality
Key Features & Functionality
1. Real-Time Weather Retrieval
The app dynamically queries the OpenWeather API, ensuring users receive up-to-date weather data tailored to their selected location.
2. Interactive Visualization
Streamlit's built-in charting tools enhance the experience by displaying weather trends intuitively, allowing users to track variations over time.
3. CSV Export for Data Tracking
To improve usability, an optional CSV export feature enables users to save weather data and analyze historical trends. This is particularly useful for researchers, data enthusiasts, or anyone monitoring specific climate patterns.
4. Responsive & Accessible UI
Designed with simplicity in mind, this application offers a clean, responsive interface, making weather insights easy to navigate for casual users and professionals alike.
Development Process & Version Control
Throughout the project, Git was used for version control, ensuring organized code management and facilitating potential collaboration or future enhancements.
Conclusion
This weather insights tool bridges the gap between raw weather data and intuitive visualization, empowering users with real-time environmental awareness. Whether tracking trends or simply checking the forecast, the application provides a seamless experience in weather analytics.