
Enhancing Stock Market Predictions: A Deep Dive into ARIMA Modeling
Enhancing Stock Market Predictions: A Deep Dive into ARIMA Modeling
Introduction
Stock market forecasting requires a blend of statistical techniques, real-time data integration, and intuitive visualization. This project builds a Stock Comparison Tool using ARIMA modeling, Streamlit, and Yahoo Finance, enabling users to analyze trends and refine investment strategies.
Project Overview
This tool allows users to compare multiple stocks, leveraging ARIMA models to generate predictive insights. Built with Python and Streamlit, it fetches live financial data via Yahoo Finance, offering interactive forecasts and comparative analysis.
Key Features & Functionality
1. Real-Time Stock Data Retrieval
Stock data is fetched dynamically from Yahoo Finance, ensuring users access the latest trends and market fluctuations.
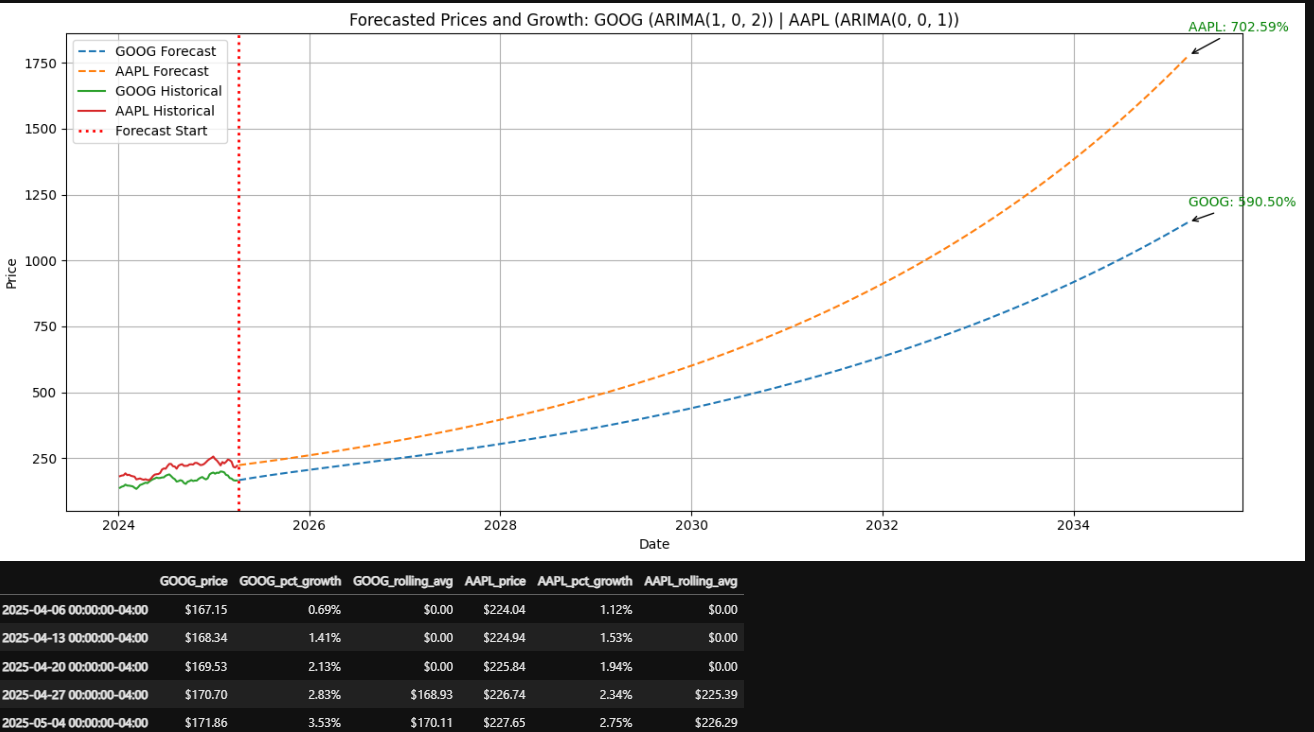
2. ARIMA-Based Forecasting
ARIMA (AutoRegressive Integrated Moving Average) is a powerful statistical technique used for time-series forecasting. The tool leverages ARIMA models to:
-
Preprocess Stock Data
-
Clean historical price data for inconsistencies.
-
Test for stationarity using the Augmented Dickey-Fuller (ADF) test.
-
Apply differencing techniques to stabilize the time series when necessary.
-
-
Identify Optimal ARIMA Parameters
-
Utilize Autocorrelation (ACF) and Partial Autocorrelation (PACF) plots to determine lag values.
-
Select the best (p, d, q) values through iterative testing.
-
Optimize models using grid search and evaluation metrics (AIC, RMSE).
-
-
Forecast Future Stock Prices
-
Generate short-term and long-term predictions based on historical trends.
-
Evaluate residuals to ensure forecasting accuracy.
-
Compare predicted trends with real-time market movements for validation.
-
3. Interactive Stock Comparison
The tool enables side-by-side stock analysis, comparing historical trends, volatility, and predictive models for smarter decision-making.
4. Streamlit-Powered Visualization
Leveraging Streamlit’s interactive charts, the tool presents stock price movements, forecast trends, and model evaluations in a user-friendly format.
Development Process & Version Control
Built with Python, the project ensures clean Git-based version control, supporting scalability, reproducibility, and collaboration opportunities.
Conclusion
This Stock Comparison Tool simplifies market analysis, blending real-time data, predictive modeling, and intuitive visualization to help investors make informed decisions. Whether analyzing short-term fluctuations or long-term trends, this application empowers users with actionable insights in stock forecasting.