
Real-Time Stock Market Analytics Pipeline Using Kafka, Spark & Docker: Building a Production-Grade, Multi-Symbol Financial Data Stream — End to End
#DataPipeline #SparkStreaming #KafkaStreams #ETL #AIandData #CloudEngineering #OpenSource #Analytics #TimeSeriesData #FinancialAnalytics #DeveloperProjects
1. Why I Built This — Engineering for Markets That Never Sleep
Financial markets operate on a lifeline of fresh data. Prices move in milliseconds, liquidity shifts by the second, and the relevance of insights decays almost instantly. Traditional batch ETLs or CSV workflows can’t keep up.
I built this pipeline to solve a very real problem:
“How do you build a personal data platform that behaves like real trading infrastructure?”
The goal wasn’t academic. It was to replicate the architecture that powers:
-
algorithmic trading systems
-
brokerage data pipelines
-
portfolio monitoring dashboards
-
high-frequency analytics engines
…and to build it using fully open-source, containerised, production-grade components.
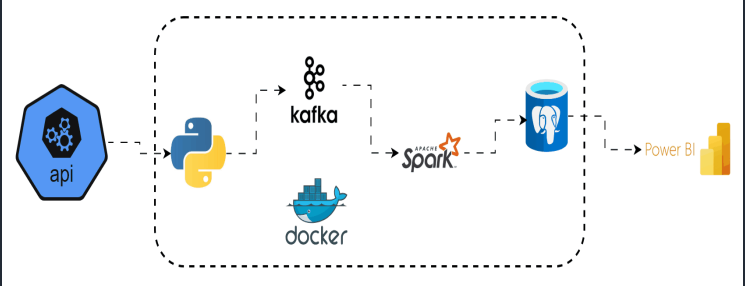
2. Architectural Overview — A Distributed Pipeline With Real Intent
The design follows a professional event-driven streaming pattern:
Alpha Vantage API → Kafka Producer → Kafka Broker → Spark Streaming → PostgreSQL → Power BI
Each layer is isolated, resilient, replayable, and scalable.
Key Capabilities:
-
Multi-symbol ingestion (e.g., AAPL, TSLA, AMZN, MSFT)
-
Real-time streaming with structured micro-batches
-
Instant visualisation
-
Durable time-series storage
-
Fully containerised deployment
This is how modern financial pipelines operate behind the scenes.
3. Multi-Symbol Live Data Ingestion — Capturing the Pulse of the Market
The pipeline begins where all good market systems begin: the data feed.
A dedicated API Producer service queries Alpha Vantage at controlled intervals, fetching multiple ticker symbols in parallel. Each response includes granular OHLCV metrics:
- Open High Low Close Volume Timestamp
Sample Code:
symbols = ["AAPL", "TSLA", "MSFT", "AMZN"]

def fetch_symbol(symbol):
    url = f"{BASE_URL}&symbol={symbol}"
    return requests.get(url).json()

for s in symbols:
    payload = fetch_symbol(s)
    producer.send("stocks_topic", value=payload)
Even when downstream systems restart, the producer continues publishing reliably thanks to Kafka’s durability.
4. Kafka Producer — Turning Market Calls Into Real-Time Events
Instead of writing raw responses to disk, the system emits structured, timestamped JSON events into Kafka.
Why?
Because trading systems rely on streams, not files.
Kafka provides:
-
Event durability — no missing bars
-
Independent scaling — Spark, Postgres, and Power BI work at their own pace
-
Replayable offsets — backfill days of events by simply rewinding
-
High throughput, even with multiple symbols
This is the same pattern used by market data hubs and broker APIs.
5. Kafka Broker — The Market’s “Heartbeat Buffer”
Kafka sits at the centre of the pipeline, acting like a durable, scalable data bus.
Every price update becomes an immutable event stored in a topic partition.
If Spark slows down? Kafka buffers.
If Postgres restarts? Kafka waits.
If you want to reprocess last week's data? Kafka replays it.
It’s the perfect backbone for streaming financial systems:
-
Handles spikes in feed volume
-
Guarantees ordering per symbol
-
Allows parallel consumption
-
Ensures the pipeline never loses events
6. Spark Structured Streaming — Transforming Raw Data Into Analytics Gold
Spark takes raw Kafka messages and turns them into clean, structured, analytics-ready records.
What Spark Does Here
-
Parses nested JSON
-
Normalises timestamps (exchange time → UTC)
-
Flatten OHLCV fields
-
Tags the symbol
-
Removes duplicates across micro-batches
-
Writes enriched rows into PostgreSQL
Consumer Snippet:
raw = (
    spark.readStream.format("kafka")
    .option("subscribe", "stocks_topic")
    .load()
)

parsed = raw.selectExpr("CAST(value AS STRING)").select(from_json(col("value"), schema).alias("data"))
clean = parsed.select("data.*")
Spark ensures your transformations stay fast, distributed, and ready for scale.
7. PostgreSQL — A Clean, Durable Time-Series Database
Once transformed, data is moved into PostgreSQL: a robust, SQL-friendly analytics store. It becomes the permanent record of market behaviour.
Example query:
SELECT symbol, bar_time, open, close, volume
FROM events_stream
WHERE symbol = 'TSLA'
ORDER BY bar_time DESC;
You can now:
-
Build a live dashboard
-
Backtest trading strategies
-
Train ML models
-
Perform anomaly detection
-
Detect price patterns
Postgres becomes the internal market history.
8. Power BI — Real-Time Visual Intelligence
Power BI connects directly to Postgres, providing a rich and constantly updating analytics interface. Dashboard can include:
-
Real-time candlesticks
-
Volume flow charts
-
Multi-symbol comparisons
-
Volatility overlays
-
Intraday behaviour analysis
This transforms the pipeline from a technical achievement into a decision-making tool.
9. Docker Compose — Infrastructure That Behaves Like Production
Everything runs inside containers:
-
Kafka
-
Kafka UI
-
Producer API
-
Spark Master & Worker
-
PostgreSQL
-
pgAdmin
One command to spin up the entire ecosystem:
docker compose up -d --build
This approach guarantees:
-
Repeatability
-
Environment isolation
-
Fast onboarding
-
Production-grade behaviour
If you want to deploy it on a server or cloud VM, the stack works unmodified.
10. Monitoring, Debugging & Observability
You get full transparency into system health:
UIs:
-
Spark Master → http://localhost:8080
-
Kafka UI → http://localhost:8082
-
pgAdmin → http://localhost:5050
Logs:
docker compose logs -f api
docker compose logs -f spark
docker compose logs -f kafka
Runtime checks:
docker compose exec spark bash -lc \
"ls /opt/bitnami/spark/jars | grep kafka"
Debugging a distributed system becomes straightforward.
11. The Engineering Impact — Why This Architecture Matters
This pipeline isn’t just a project. It demonstrates my ability to build real-time, distributed, production-grade data systems. The architecture showcases:
-
Event-driven design
-
Real-time stream processing
-
Distributed computing concepts
-
Container orchestration
-
Data modelling for time-series analytics
-
Multi-service resilience and scaling
It’s the exact type of system modern fintech and data engineering teams rely on.
12. Multi-Symbol Scaling — The Most Underrated Feature
Most demo pipelines ingest one symbol. This one handles many, thanks to:
-
asynchronous API calls
-
per-symbol Kafka event partitioning
-
Spark’s distributed micro-batch execution
This single design choice elevates the project from "tutorial" to serious infrastructure.
13. Project Structure
Project1-StockMarket/
├── docker-compose.yml
├── spark/
│   ├── consumer.py
│   └── Dockerfile
├── api/
│   ├── producer.py
│   └── requirements.txt
├── db_init/
│   └── schema_tables.sql
└── notebooks/
    └── stock_market_analysis.pbix
Clean. Modular. Production-aligned.
14. Future Extensions — Where This Can Go Next
The architecture is strong enough to evolve into:
-
a real trading signal engine
-
an LSTM-based prediction service
-
a market microstructure anomaly detector
-
a Kubernetes-scaled streaming cluster
-
a cloud-hosted analytics platform
The foundation is already enterprise-grade.
Conclusion — A Production-Ready Fintech Pipeline, Built End to End
This project demonstrates that one can engineer the same streaming architecture used by financial institutions, hedge funds, and trading platforms end-to-end, containerised, and real-time. I've built:
-
a resilient ingestion system
-
a distributed processing engine
-
a durable analytics database
-
a live visual analytics interface
…and it handles multiple symbols, continuously, with fault tolerance and replayability.
This is #modern-data-engineering. This is #fintech-grade-real-time analytics.